Monitoring
The HTTP server in Routinator provides endpoints for monitoring the application on the following paths:
/versionReturns the version of the Routinator instance
/metricsExposes exhaustive time series data specifically for Prometheus, containing metrics on all trust anchors, repositories, RRDP and rsync connections, as well as RTR and HTTP sessions. If desired, dedicated port 9556 is allocated for the exporter.
/api/v1/statusReturns exhaustive information in JSON format on all trust anchors, repositories, RRDP and rsync connections, as well as RTR and HTTP sessions. This data set provides the source for the Routinator user interface.
/statusReturns a subset of the metrics information in a concise plain text format
Metrics
- Update metrics
When the last update started and finished
The total duration of the last update
The retrieval duration and exit code for each rsync publication point
The retrieval duration and HTTP status code for each RRDP publication point
- Object metrics
For each cryptographic object that can appear in the RPKI, the number of valid, invalid and stale items per trust anchor and repository
The number of validated ROA payloads (VRPs) per Trust Anchor and repository
The number of VRPs added and excluded locally
- RTR server
The current RTR serial number
The current number of RTR connections
The total amount of bytes sent and received over the RTR connection
Metrics for each RTR client is available if the
--rtr-client-metricsoption is provided
- HTTP server
The current number of HTTP connections
The total amount of bytes sent and received over the HTTP connection
The number of HTTP requests
Refer to the Reference section for a complete overview for all metrics in the JSON format and the Prometheus format.
Grafana
Using the Prometheus endpoint it’s possible to build a detailed dashboard using for example Grafana. We provide a template to get started.
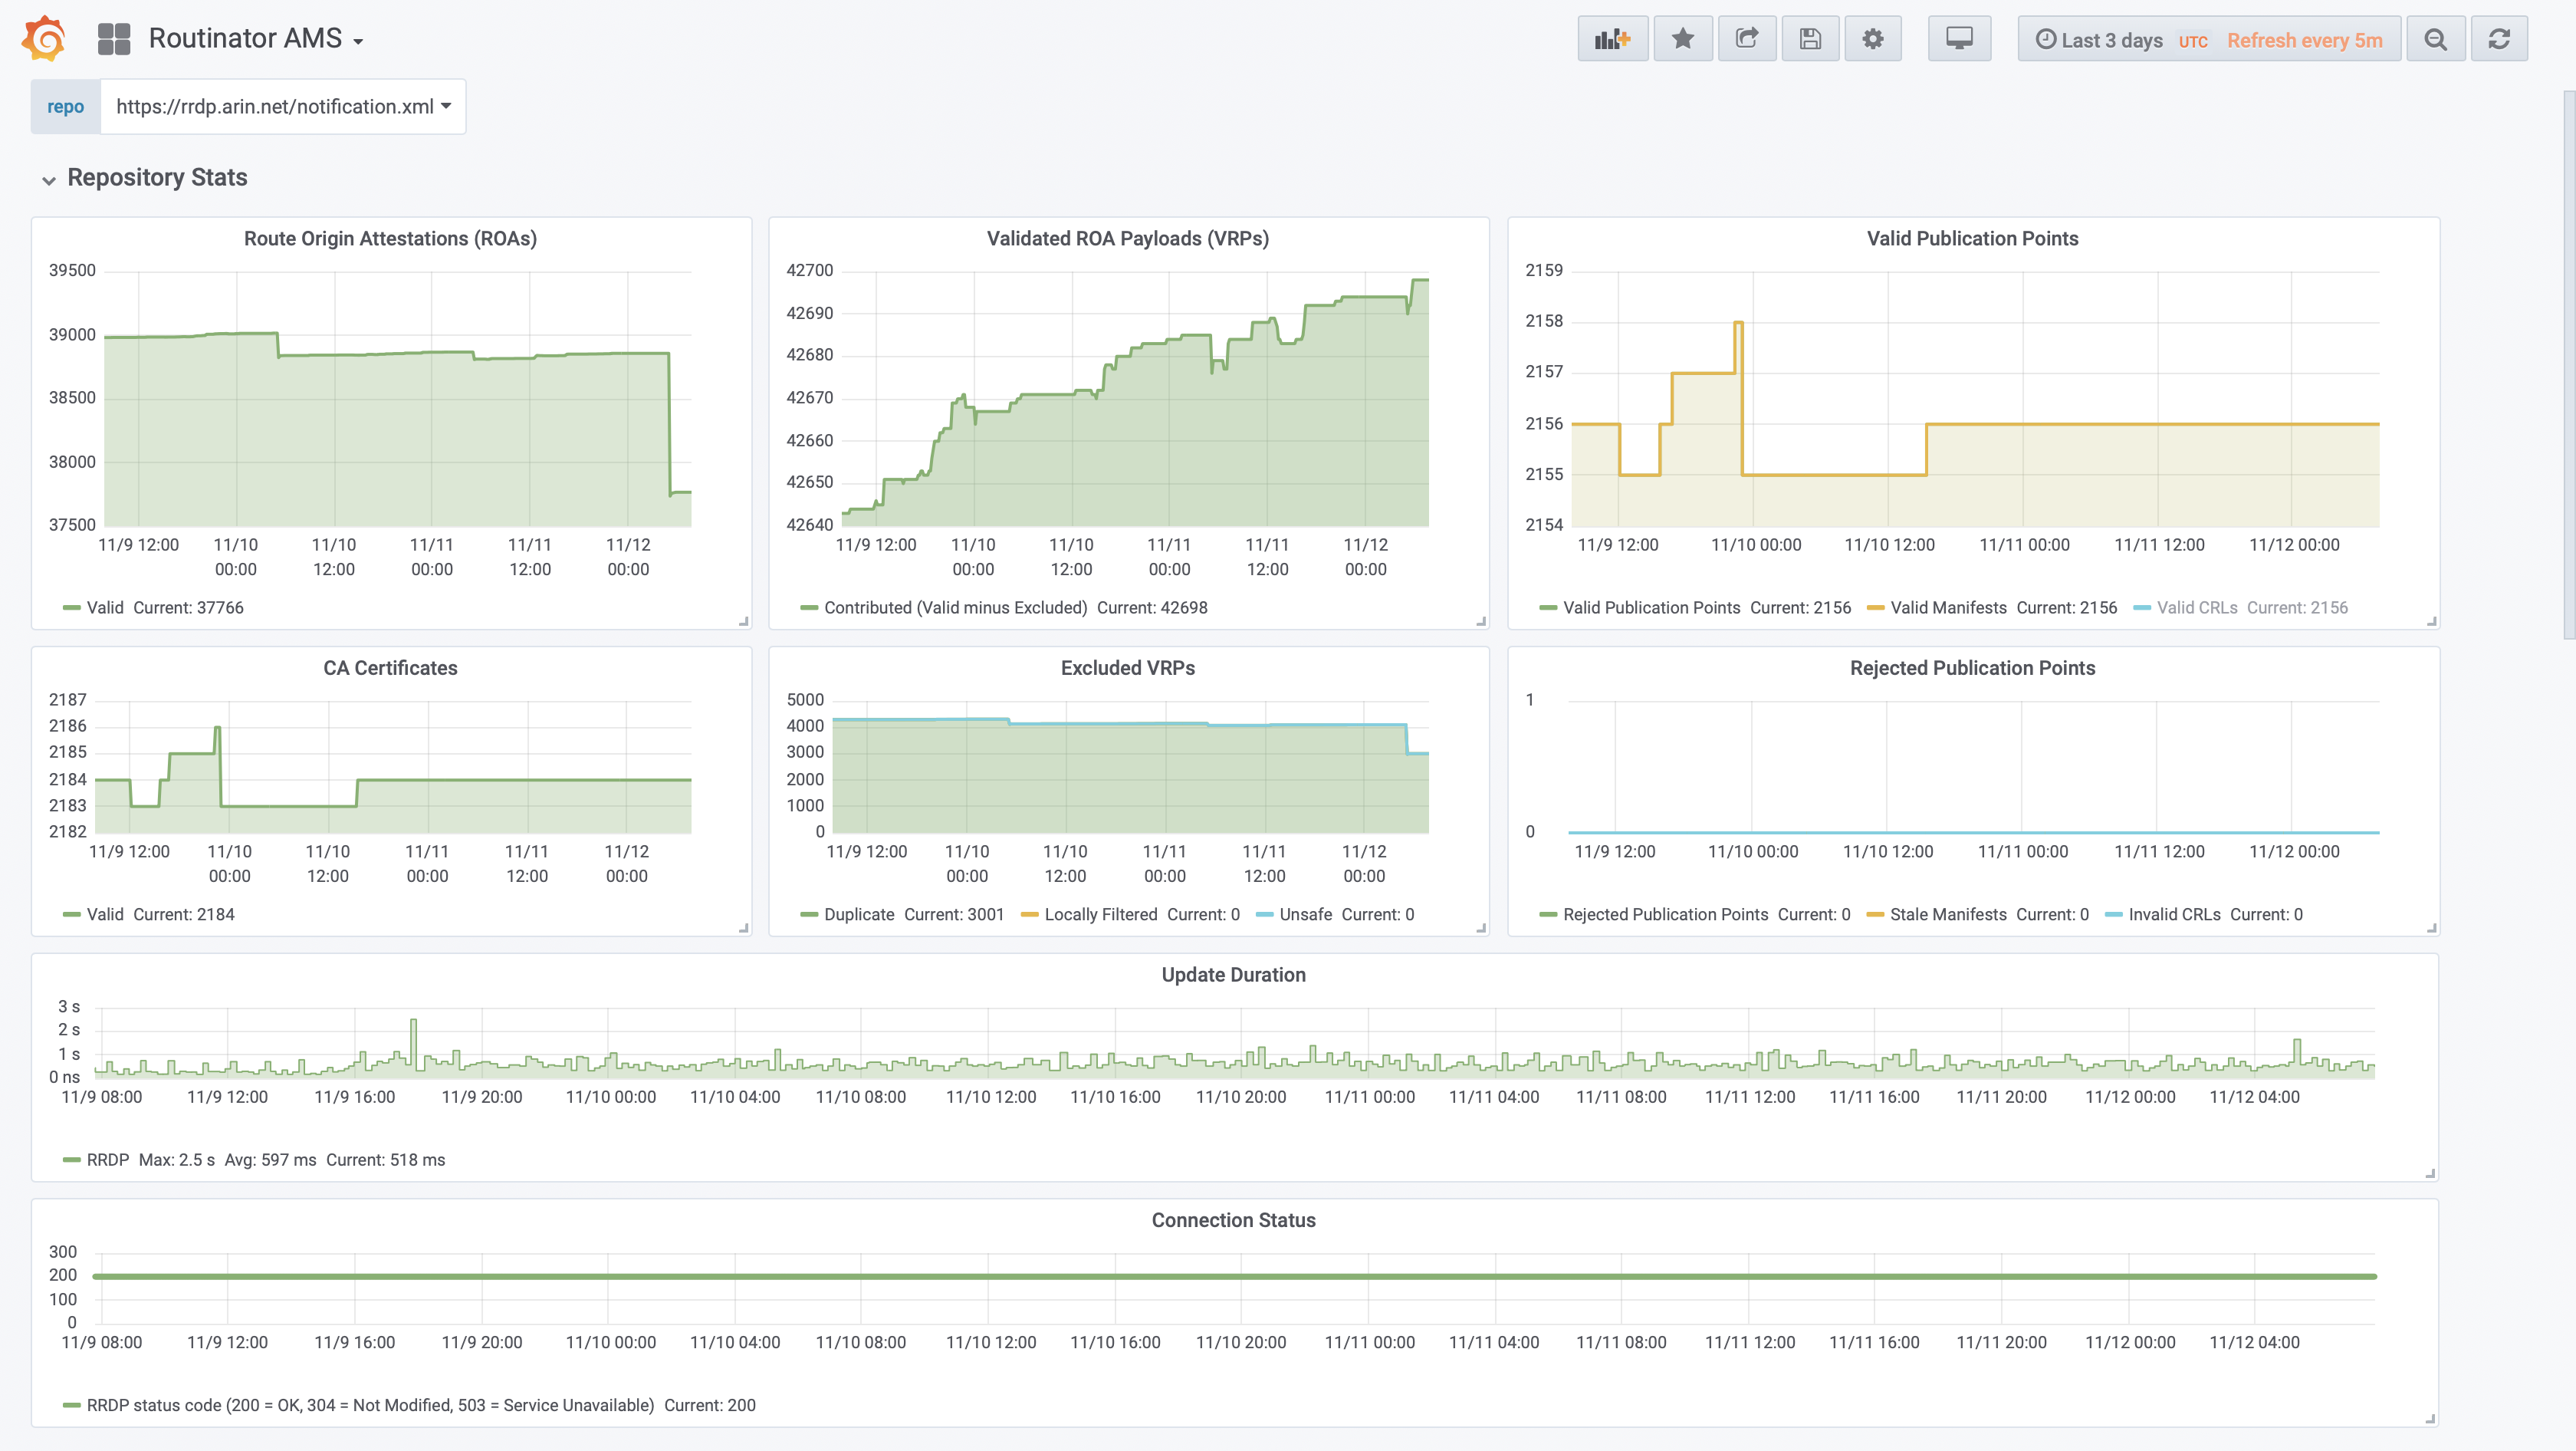
Time series for each RPKI Repository
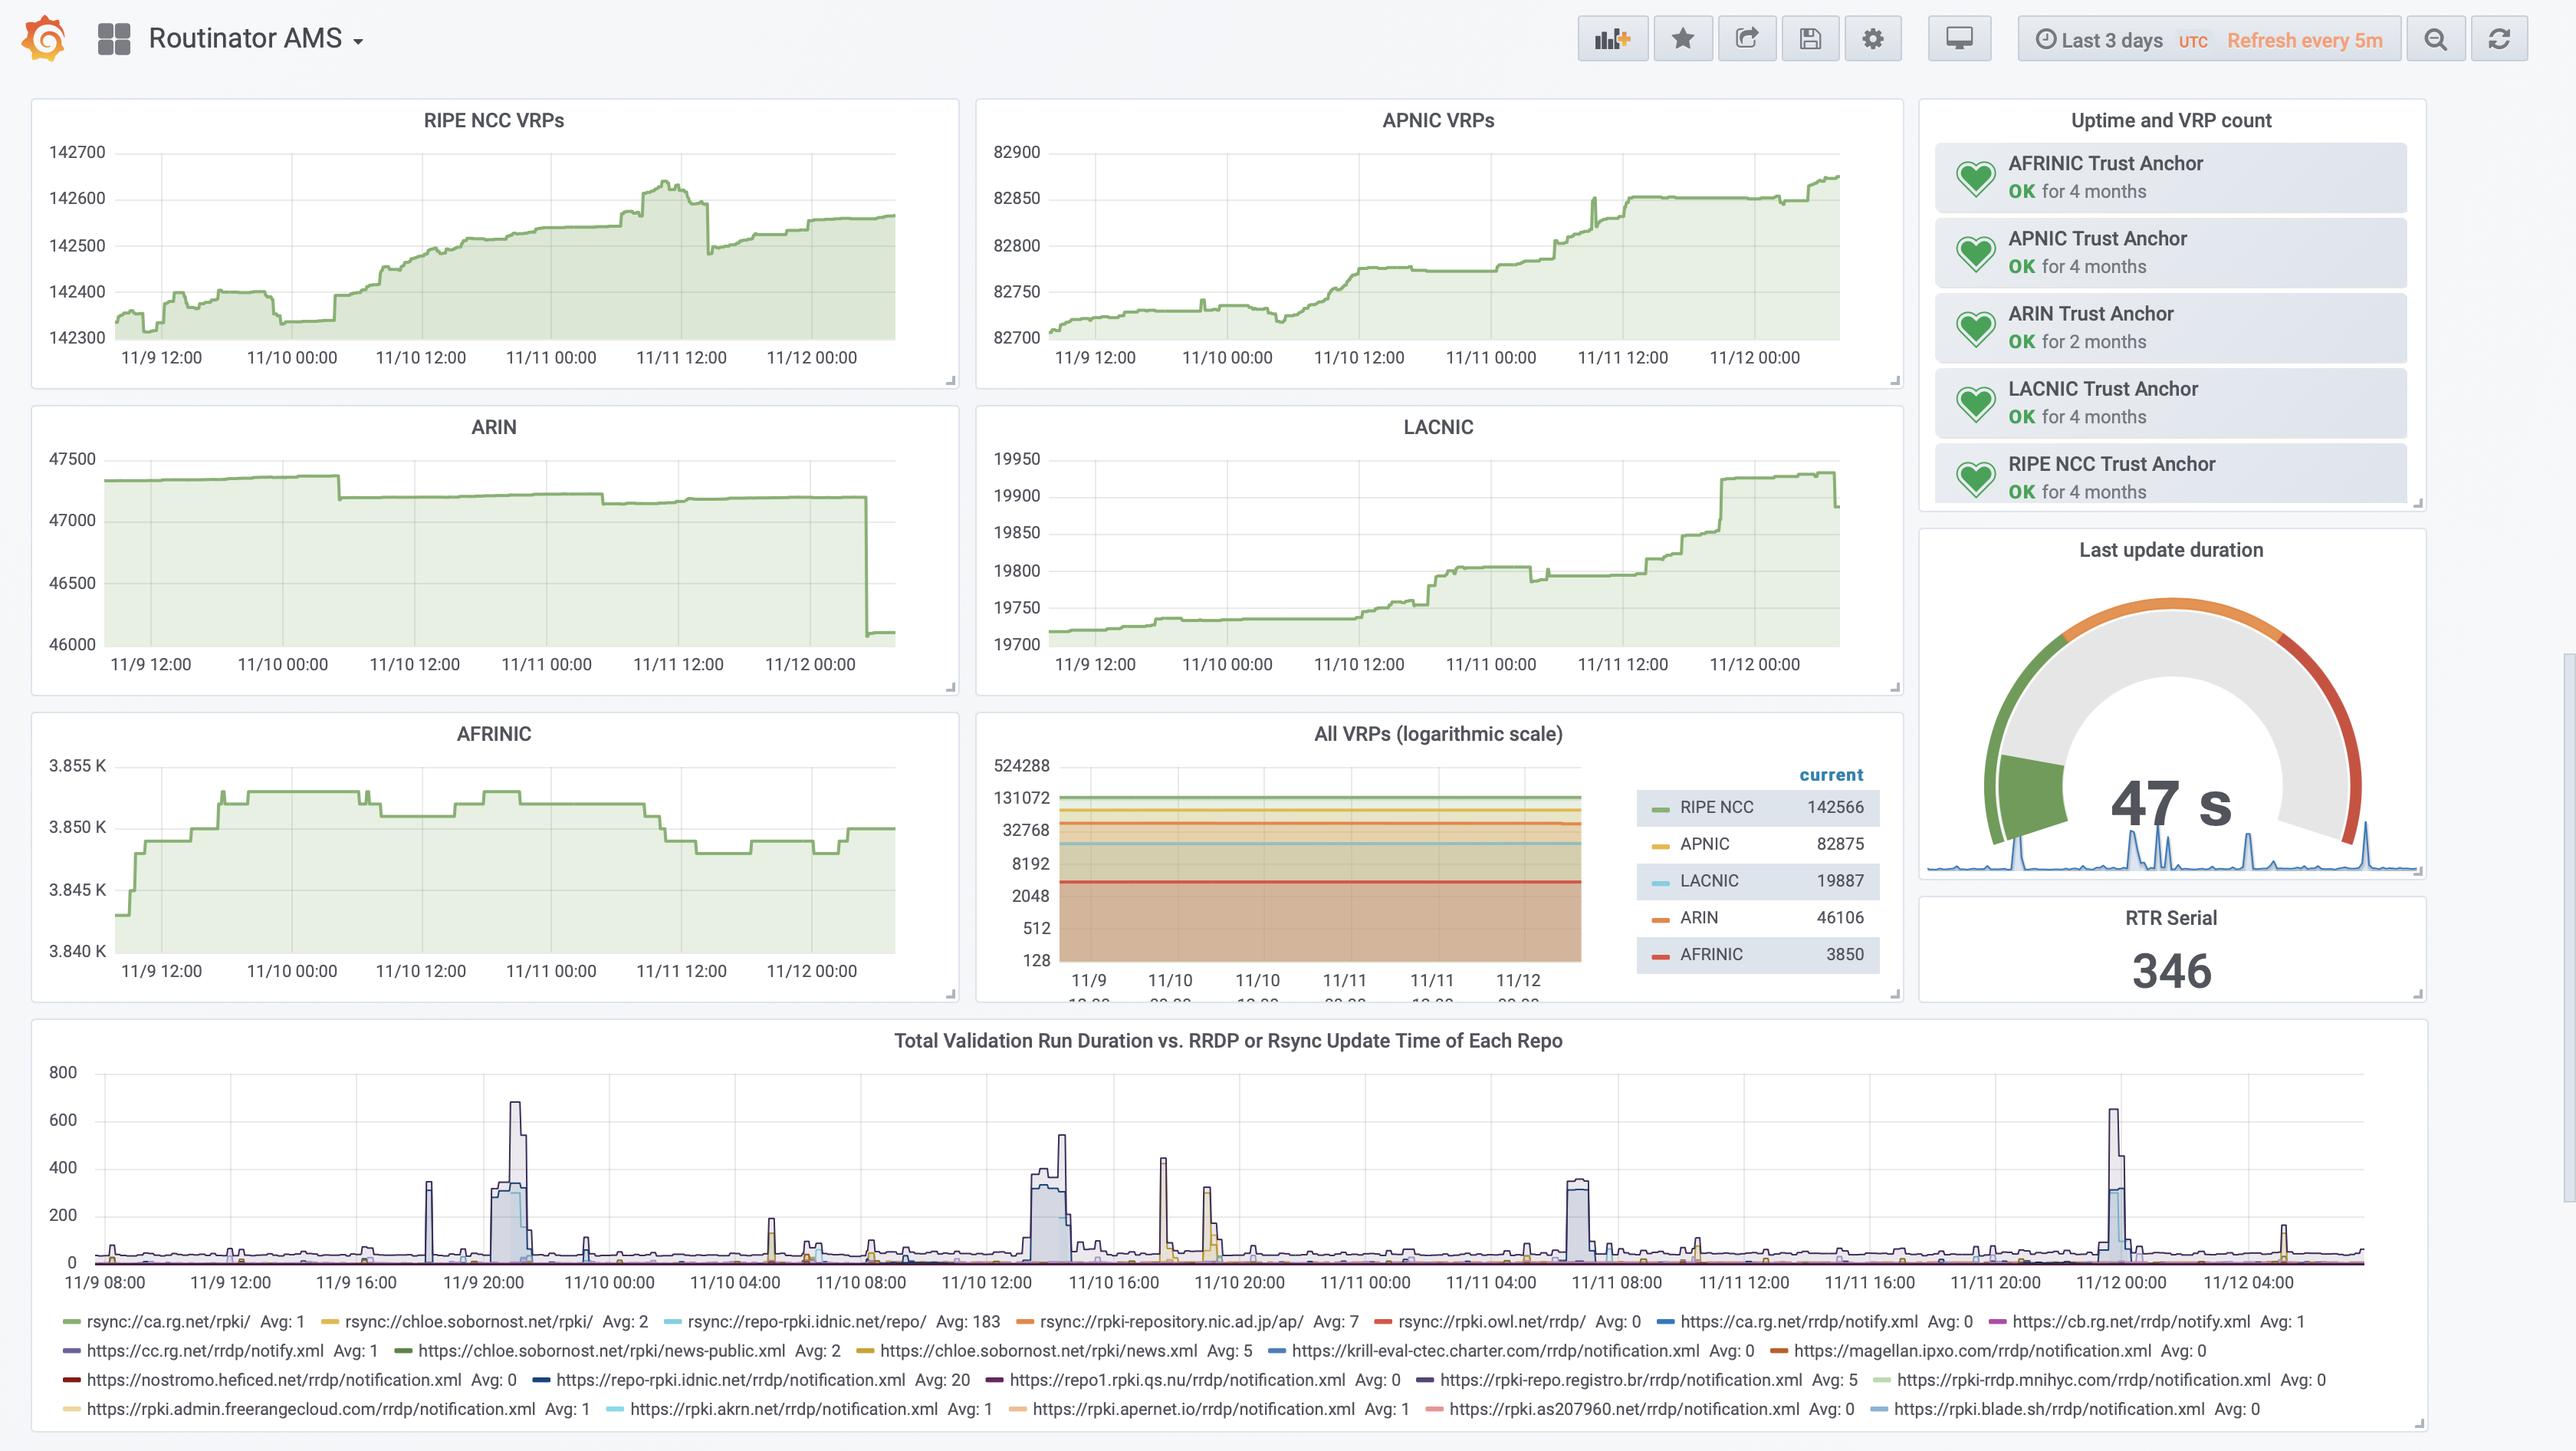
Time series for each Trust Anchor